Saturday, January 6, 2018

The Closing Bell

The Closing Bell

1/6/18

Statistical Summary

   Current Economic Forecast
                       
2018 estimates (revised)

Real Growth in Gross Domestic Product                          1.5-2.5%
                        Inflation                                                                          +1.5-2%
                        Corporate Profits                                                                5-10%

   Current Market Forecast
           
            Dow Jones Industrial Average

                                    Current Trend (revised):  
                                    Short Term Uptrend                                 23217-25953
Intermediate Term Uptrend                     12794-29000
Long Term Uptrend                                  6009-29456
                                               
2018     Year End Fair Value                                   13800-14000

            Standard & Poor’s 500

                                    Current Trend (revised):
                                    Short Term Uptrend                                     2354-3125
                                    Intermediate Term Uptrend                         1236-30501
                                    Long Term Uptrend                                     905-2963
                                                           
2018 Year End Fair Value                                       1700-1720         


Percentage Cash in Our Portfolios

Dividend Growth Portfolio                          59%
            High Yield Portfolio                                     55%
            Aggressive Growth Portfolio                        55%

Economics/Politics
           
The Trump economy is providing a higher upward bias to equity valuations.   The data flow this week was again upbeat: above estimates: weekly purchase applications, December retail chain store sales, December light vehicle sales, the December ADP private payroll report, November construction spending, November factory orders, the December Markit manufacturing and services PMI’s, the December ISM manufacturing index; below estimates: weekly mortgage applications, month to date retail chain store sales, December nonfarm payrolls, weekly jobless claims, the December ISM nonmanufacturing index, the November trade deficit; in line with estimates: none.
           
The primary indicators were also positive: November construction spending (+), November factory orders (+) and December nonfarm payrolls (-).  The call is positive.  Score: in the last 117 weeks, forty were positive, fifty-six negative and twenty-one neutral.

Overseas, the pattern remains the same: strength in Europe which is likely contributing to a pick in growth here; not so much in the rest of the globe. Indeed, despite the media rhetoric to the contrary, the Chinese data has shown scant improvement since the conclusion of the Chinese Communist Party Congress; and that will likely be aggravated by the recent tightening in standards for the financial industry which are being implemented to halt the excessive use of debt.

China admits economic data miscalculation

In short, the trend over the last two months has clearly been upbeat.  Whether this spurt is the last hoorah of an eight year below average expansion or the sudden liftoff to a new and glorious growth phase in the economy is the big question. 

My vote is the former because (1) as noted, this expansion is already long in the tooth; and while it has been below average in magnitude, it is still reaching historical end of cycle markers, like unemployment and profit margins, (2) I don’t believe that the tax reform package will provide an enduring increase in the US long term secular growth rate,  (3) we don’t how much of the recent advance in economic activity is the result of the inevitable short term pick up that occurs after disasters such as the three hurricanes that we experienced last fall and (4) the debt level in all sectors of the economy are so high, I don’t see how the US can undergo a rise in its long term secular growth rate at the same time that those levels of debt have to be serviced.  Furthermore, if we see long rates at 5%, not only will the Fed be technically bankrupt but the majority of tax revenue will go to just pay the interest cost on the debt.

The budget deficit

            And all the other debt (medium):

On the other hand, (1) I have already raised my long term secular economic growth rate assumption based on an improved regulatory environment; so some of the recent increase reflects that, (2) certainly, the pickup in global economic activity is a contributor to the better numbers. 

But the question is the same as I raised above, to wit, is this a last hoorah or the dawning of a new age?  My answer is the same---the debt levels in the EU, China and Japan are so astronomical, that servicing that debt will simply take too many resources that could otherwise be used for growth.  Plus, we have no idea what the magnitude or quality of the debt is in China; though we do know that a decent percentage of it is nonperforming.

Finally, remember that I am not bear on the economy. My issue isn’t whether it will keep growing; my issue is by how much.

Our (new and improved) forecast:

A pick up in the long term secular economic growth rate based on less government regulation.  As a result, I have raised our 2018 growth forecast. This increase in secular growth could be further augmented by pro-growth fiscal policies including repeal of Obamacare and enactment of (revenue neutral) tax reform and infrastructure spending.  We may be getting the former, but, unfortunately, not the revenue neutral tax reform as it will expand the national debt by another $1.5 trillion.  As a result, I fear the odds of an additional bump in the long term secular growth rate of the economy are low.

To be sure, short term growth is improving, propelled by improved psychology and a pickup in international growth.  However, I have doubts that the former will lead to any permanent increase in the long term secular growth rate.
                       
       The negatives:

(1)   a vulnerable global banking system.  Nothing new.

(2)   fiscal/regulatory policy. 

With tax reform out of the way, the next big issue is the passage of the FY 2018 budget and how the inevitable rise in the deficit will be handled, given the current restraint imposed by prior legislation.  This is another one of those dead horses that is a waste of time for me to beat: given the current level of the deficit and debt, whatever our ruling class comes up with, anything short of significant spending cuts across the board will inhibit not stimulate growth.

You know my bottom line, too much debt stymies economic growth even if it partly comes from a tax cut.


(3)   the potential negative impact of central bank money printing:  The key point here is that [a] the Fed has inflated bank reserves far beyond any comparable level in history and [b] while this hasn’t been an economic problem to date, {i} it still has to withdraw all those reserves from the system without creating any disruptions---a task that I regularly point out it has proven inept at in the past and {ii} it has created or is creating asset bubbles in the stock market as well as in the auto, student and mortgage loan markets.  

The FOMC released the minutes of its last meeting this week.  Nothing really changed [a] because the same dovish crew is making the decisions and [b] even if the Committee’s composition had changed, nothing would have been done in lieu of the imminent arrival of a new Fed chief.  A lot of ink is going to get spilled over the coming months interpreting his comments and any shifts, however subtle, in policy.  Regrettably, all signs to date is that he will do little to extricate the Fed from its current policy dreamland.

I include this article because of its absurdity.  The author speculates that the Fed worrying about how to deal with the next recession as opposed to dealing with its $4 trillion balance sheet.  That may be the case but it demonstrates how contorted the policy making inside the Fed is.

You know my bottom line: when QE starts to unwind, so does the mispricing and misallocation of assets.  That thesis is about to be tested.
    

(4)   geopolitical risks:  Two new developments, both potentially positive: [a] North Korea reaching out to the South and [b] the civil unrest in Iran.  It is not clear what the results will be but it seems that they are more likely to be a plus.


(5)   economic difficulties around the globe.  The stats this week were in line with recent trends.  Much more of this and I will remove this factor as a risk.


[a] December EU composite PMI and the UK services PMI were above forecasts; December EU inflation declined; the December German unemployment rate hit a record low,

[b] December Chinese Caixin services PMI was above estimates.

The bottom line remains the same [Europe gaining strength, Japan may be improving, China is a question simply because the government lies] but the warning light is flashing indicating the potential for a more upbeat outlook.


            Bottom line:  the US economy growth rate appears to be improving as a result of a combination of the positive impact on its secular growth rate brought on by increasing deregulation, plus rising business and consumer sentiment stemming from the passage of tax reform and the better performance of the EU economy.  The issue is, will this pick in economic activity have any legs?  I remain skeptical because (1) the current recovery is already at record length and (2) the tax bill, in my opinion, will do little to stimulate growth.  There is the possibility that the current acceleration in economic activity is largely sentiment driven and that by itself could prove me wrong.  However, I believe that the more likely scenario is loss of business and consumer optimism when they realize the tax bill will do little to improve the economic overall well-being of this country.

The Market-Disciplined Investing
         
  Technical

The indices (DJIA 25295, S&P 2743) are in a Titan III formation, as the rate of increase continues to increase.  Volume declined on Friday though it is still high; breadth was strong.  The bottom line remains that both of the Averages continue to trade above their 100 and 200 day moving averages and are in uptrends across all time frames---with the assumption being that stock prices are going higher.
           
While stock investors are enthused about ‘global synchronized growth’, the investors in the long Treasury, the dollar and gold are not supporting that view as bonds and gold rally and the dollar continues to get whacked.

Bottom line: long term, the indices remain strong viz a viz their moving averages and uptrends across all timeframes. Short term, they are above the resistance level marked by their August highs, meaning that there is no resistance between current price levels and the upper boundaries of the Averages long term uptrends. The technical assumption has to be that stocks are going higher.  The pin action in TLT, UUP and GLD is causing me a lot of cognitive dissonance.    I remain confused and uncomfortable with the overall technical picture.

            Chinese liquidity injections are helping to move global markets (medium):

            Retail investors aren’t (medium):

Fundamental-A Dividend Growth Investment Strategy

The DJIA and the S&P are well above ‘Fair Value’ (as calculated by our Valuation Model).  However, ‘Fair Value’ has risen based on a new set of regulatory policies which will lead to improvement in the historically low long term secular growth rate of the economy. 

Consequently, I raised my 2018 GDP, corporate growth and Fair Value estimates.  However, I have serious doubts that the tax reform bill will do anything to improve the long term secular economic growth rate.  That said, I have to point out that a number very smart analysts for whom I have great respect disagree with this position.  We will probably know who is right sometime in early 2018.

In short, I believe that Street estimates for economic and corporate profit growth based on a stimulative tax reform are too optimistic.  As a result, if stocks continue to fly on this notion, they will discount even more future growth that is either not there or so far in the future as to not be really relevant to today’s valuations.  And when investors wake up from this fairy tale that could, in turn, lead to declining valuations. 

That said, fiscal policy is a distant second where it comes to Market impact.  The 800 pound gorilla for equity valuations is central bank monetary policy based on the thesis that (1) QE did little to help the economy but led to extreme distortions in asset pricing and allocation and (2) hence, its unwinding will do little to hurt the economy but much to equities as the severe perversion of security valuations is undone. 

The Phillips curve versus the Laffer curve (medium):

At this point, I couldn’t be more at odds with Market extremely positive sentiment grounded on the assumption that the Fed has the Market’s back and will pursue the unwinding of QE only to the extent that it does not disrupt the Markets.  To be sure, the thesis has proven correct to date.  However, I believe that the monetary authorities have created huge asset price distortions just as they did in 2000 and 2008; and given their abject failure to transition to normalize monetary policy in the past, I doubt that they will do so this time.  Unfortunately, this time around those distortions are the most extreme in history; so I expect the subsequent price adjustments will be very painful.

Bottom line: the assumptions on long term secular growth in our Economic Model have improved as a result of a new regulatory regime.  Plus, there is a ray of hope (though fading) that fiscal policy could further increase that growth assumption though its timing and magnitude are unknown.  On the other hand, if it raises the deficit/debt, I believe that it would negate any potential positive. In any case, I continue to believe that the current Street narrative is overly optimistic---which means Street models will ultimately will have to lower their consensus of Fair Value for equities. 

Our Valuation Model assumptions may be changing depending on the aforementioned economic tradeoffs impacting our Economic Model.  However, even if tax reform proves to be a positive, the math in our Valuation Model still shows that equities are way overpriced.

                As a long term investor, with equity valuations at historical highs, I would want to own some cash in my Portfolio and, if I didn’t have any, I would use the current price strength to sell a portion of my winners and all of my losers.

                        And:

DJIA             S&P

Current 2018 Year End Fair Value*              13860             1711
Fair Value as of 1/31/18                                  13266            1637
Close this week                                               25217            2743

* Just a reminder that the Year End Fair Value number is based on the long term secular growth of the earning power of productive capacity of the US economy not the near term   cyclical influences.  The model is now accounting for somewhat below average secular growth for the next 3 to 5 years. 

The Portfolios and Buy Lists are up to date.


Steve Cook received his education in investments from Harvard, where he earned an MBA, New York University, where he did post graduate work in economics and financial analysis and the CFA Institute, where he earned the Chartered Financial Analysts designation in 1973.  His 47 years of investment experience includes institutional portfolio management at Scudder. Stevens and Clark and Bear Stearns, managing a risk arbitrage hedge fund and an investment banking boutique specializing in funding second stage private companies.  Through his involvement with Strategic Stock Investments, Steve hopes that his experience can help other investors build their wealth while avoiding tough lessons that he learned the hard way.


Friday, January 5, 2018

The Morning Call--Sustainability

The Morning Call

1/5/18
The Market
         
    Technical

The indices (DJIA 25075, S&P 2723) continued their relentless drive upward. Volume was down but still high; breadth strong.  The bottom line remains that both of the Averages continue to trade above their 100 and 200 day moving averages and are in uptrends across all time frames---with the assumption being that stock prices are going higher.
           
The VIX (9.2) was up slightly (somewhat unusual on a strong up day), but still closed below its 100 and 200 day moving averages (both resistance), in a very short term downtrend but above the lower boundary of its long term trading range.

The long Treasury was down slightly, ending above its 100 and 200 day moving averages and the lower boundaries of its short term trading range and long term uptrend and right on the lower boundary of its very short term uptrend.   So bond investors remain unconvinced that rates are rising or they are looking for a safety trade.

The dollar resumed its downward trend, finishing below its 100 and 200 day moving averages (now resistance), in a short term downtrend and near the lower boundary of its long term trading range.  Dollar investors also aren’t anticipating higher rates/economic strength nor the need for a safety trade.

            Gold was up, remaining above its 100 and 200 day moving averages (now support), within a short term trading range and is developing a very short term uptrend. 

Bottom line: long term, the indices remain strong viz a viz their moving averages and uptrends across all timeframes. Short term, they are above the resistance level marked by their August highs, meaning that there is no resistance between current price levels and the upper boundaries of the Averages long term uptrends. The technical assumption has to be that stocks are going higher.  If you own enough cash to sleep at night, lay back and enjoy it.
                       
Trading in UUP, GLD and TLT continued to reflect the belief that the economy that is less strong and/or that there is less upward pressure on interest rates than consensus.    I remain confused and uncomfortable with the overall technical picture.
           
    Fundamental

       Headlines

Yesterday’s economic continued the trend of improvement: the December ADP private payroll report, the December Markit services PMI and December retail chain store sales were better than expected, while weekly jobless claims rose.

Overseas, the December EU composite PMI, the UK services PMI and the Chinese Caixin services PMI were all above forecasts.

***overnight, December EU inflation came in at 1.4% versus 1.5% in November.

Bottom line: the synchronized global recovery thesis was front and center yesterday.  And that is understandable; the numbers look great.  The question is how sustainable are they?  This growth is occurring at a time when (1) the global recovery, however, subpar it may have been, has reached an historical old age, raising the question of how much demand is left to be filled and (2) this recovery has been driven by an extraordinary expansion in debt which has to be serviced, raising the question of how any unfilled demand will be paid for.  

Plus, stock valuations leave little room for a shortfall.

Clearly, my skepticism based on equity valuations has been wrong to date.  That said, I believe it is much too late to repent and increase my Market exposure.  The good news is that our Portfolios are still 50% invested.

Enjoy the ride while it lasts, but be sure your portfolio has some protection like cash.

       Investing for Survival
   
            Doug Kass’s 15 predictions for 2018---Part 2:

    News on Stocks in Our Portfolios


Economics

   This Week’s Data

            The December Markit services PMI came in at 53.7 versus forecasts of 52.4.

            December retail chain store sales improved on a year over year basis.

            December nonfarm payrolls were up 148,000 versus expectations of up 191,000.

            The November trade deficit was $50.5 billion versus estimates of $50.0 billion.

   Other

            EU regulations on paying for equity research and trading are changing.  You need to be aware of the possible consequences (medium):

            This is a 2018 forecast from my favorite optimist.  I think that he makes a number of very good points with respect to the prospects for economic growth; and certainly, he could be right.  But I think that he wrong on a key point, which is the reinvestment of funds distributed to shareholders being a source of economic growth.  That would be true if investors put that money in private equity deals that are the primary source of funding new businesses.  As it is, the money gets reinvested in the same set of stocks of companies that are buying back stock and upping their dividends, which only results in driving equity prices higher---something he skips over.  In any case, he provides a good counterpoint to my outlook that is worth considering.

Politics

  Domestic

  International War Against Radical Islam


Visit Investing for Survival’s website (http://investingforsurvival.com/home) to learn more about our Investment Strategy, Prices Disciplines and Subscriber Service.


Thursday, January 4, 2018

The Morning Call--Hitting on all cylinders

The Morning Call

1/4/18
The Market
         
    Technical

The indices (DJIA 24922, S&P 2713) had another good day. Volume was up substantially; breadth strong.  The bottom line remains that both of the Averages continue to trade above their 100 and 200 day moving averages and are in uptrends across all time frames---with the assumption being that stock prices are going higher.
           
The VIX (9.1) was pounded down 6 ½ %, closing below its 100 and 200 day moving averages (both resistance), in a very short term downtrend but above the lower boundary of its long term trading range.

The long Treasury was up, ending back above the lower boundary its very short term uptrend, above its 100 and 200 day moving averages and the lower boundaries of its short term trading range and long term uptrend.   So bond investors remain unconvinced that rates are rising or they are looking for a safety trade.

The dollar rebounded a tad, but still finished below its 100 and 200 day moving averages (now resistance), in a short term downtrend and near the lower boundary of its long term trading range.  Dollar investors also aren’t anticipating higher rates/economic strength nor the need for a safety trade.

            Gold was down slightly, but remained above its 100 and 200 day moving averages (now support) and within a short term trading range. 

Bottom line: long term, the indices remain strong viz a viz their moving averages and uptrends across all timeframes. Short term, they are above the resistance level marked by their August highs, meaning that there is no resistance between current price levels and the upper boundaries of the Averages long term uptrends. The technical assumption has to be that stocks are going higher.  If you own enough cash to sleep at night, lay back and enjoy it.
           
            Fueling the bull market (short):

Trading in UUP, GLD and TLT continued to reflect the belief that the economy that is less strong and/or that there is less upward pressure on interest rates than consensus.    I remain confused and uncomfortable with the overall technical picture.
           
            Taking stock of a weird year (medium):


    Fundamental

       Headlines

            Yesterday’s economic data were generally upbeat: the December ISM manufacturing index, November construction spending, the December Markit PMI manufacturing index and weekly purchase applications were above consensus while month to date retail chain store sales and weekly mortgage applications were below---in line with our improving economy scenario.

            Overseas, the German unemployment rate hit a record low.

            ***overnight, the December EU composite PMI, the UK services PMI and the Chinese Caixin services PMI were all above forecasts.

            The FOMC released the minutes of its latest meeting; the bottom line is that the narrative has not changed that much---the tax increase should stimulate consumer and business spending, inflation should continue to work its way higher, we should expect at least three rate hikes in 2018 with the stipulation that the Fed will so nothing to upset the Market apple cart.  I will say that both the hawks and the doves were more aggressive in stating their positions; but I suspect that they felt more comfortable upping their rhetoric knowing that the meeting meant nothing in the scheme of things given regime change is imminent, so any real policy decisions weren’t going to be made.

Bottom line: everything remains awesome.  Certainly, in the short term, a number of factors support that notion---the economic data, the forecast impact of the tax bill and the assumption that the Fed will not risk disturbing the Markets.   As long as those theses are willingly accepted by investors, stock prices are going up.  And to be clear they may all work out exactly as anticipated.  I don’t believe that they will but they could.  That said, equity prices are now discounting everything short of the second coming.  So my position remains that at some point, reality, however positive it may be will reflected in those prices. 

Enjoy the ride while it lasts, but be sure your portfolio has some protection like cash.

            Some perspective on 2017 Market action (short):

            Fourth quarter dividend growth (short):

            The latest from SocGen (medium):

            Update on valuations (medium):

       ETF Highlight

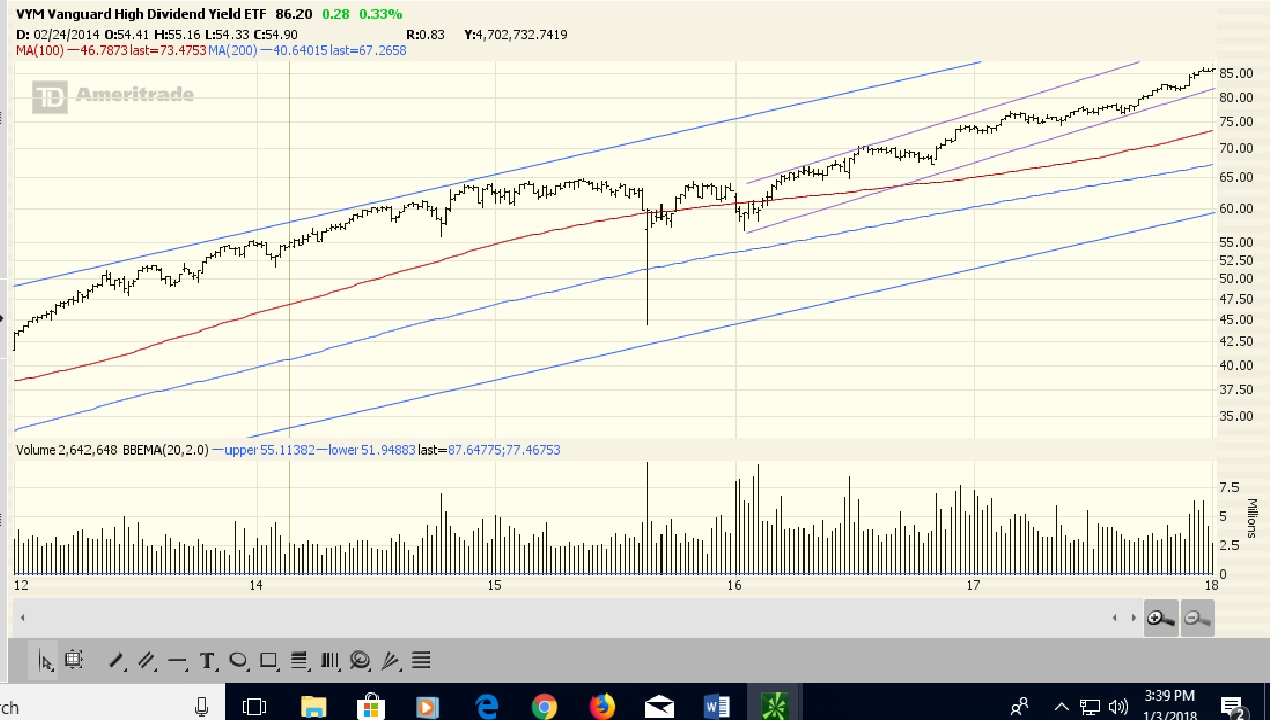
VYM offers a diversified, conservative approach to high dividend yield in a low-cost wrapper. The fund’s broad basket stems partly from its comparatively lax dividend screens: Firms are ranked by forecast dividends over the next 12 months; those in the top half are selected. Stocks that make the cut are weighted by market cap rather than dividends, an approach also used by our benchmark. As a result, the broad portfolio aligns well with our benchmark by firm size, yield, and sector exposure. REITs are out of bounds too, in keeping with the conservative approach. Investors can access VYM at a very low round-trip cost thanks to its tiny fee, excellent tracking, and robust liquidity. This makes it a great choice for those looking for cheap, liquid high-dividend equity exposure, though income-starved investors can find higher yields elsewhere.  VYM’s expense ratio is .08% and its yield is 2.79%.  The ETF Portfolio owns a 25% position in this ETF.


       Investing for Survival
           
Doug Kass’s 15 predictions for 2018---Part 1:
           
    News on Stocks in Our Portfolios


Economics

   This Week’s Data

            Month to date retail chain store sales growth were less than in the prior week.

            The December ISM manufacturing index came in at 59.7 versus expectations of 58.1.

            November construction spending rose 0.8% versus estimates of +0.6%.

            December light vehicle sales were slightly above forecasts.

            The December ADP private payroll report showed job increases of 250,000 versus consensus of 188,000.

            Weekly jobless claims rose 3,000 versus projections of a 5,000 decrease.

   Other

            More criticism on the tax bill; this from a firm dem supporter (medium):

            And this from David Stockman (medium):

            Some thoughts on inflation (medium):

            The rising debt problem (medium):

            The missing ingredient to growth (medium):

Politics

  Domestic

Quote of the day (short):

  International War Against Radical Islam

            Inside Iran (medium):

Visit Investing for Survival’s website (http://investingforsurvival.com/home) to learn more about our Investment Strategy, Prices Disciplines and Subscriber Service.


Wednesday, January 3, 2018

Wednesday Morning Chartology

The Morning Call

1/3/18
The Market
         
Technical

            While I was gone, my charting service changed its format.  The charts basically look the same except for the background color.  However, the moving averages have been given different colors (100-red; 200-blue).  The bad news is that as of today some of the charts haven’t updated.  In our case, the S&P and the VIX.  So today I have nothing to offer except verbiage.

            In the case of the S&P, it doesn’t really matter because, it looks the same except that the uptrend has been extended.  It remains above both moving averages and in uptrends across all timeframes.  The assumption has to be that this will continue at least until it reaches the upper boundary of its long term uptrend

            And:

            In my absence, the long Treasury recovered above its 100 day moving average and the lower boundary of a very short term uptrend.  Though yesterday, it broke back below the uptrend, but remains above the 100 day moving average.  It is also above the lower boundaries of its short term trading range and its long term uptrend.  This is a bit directionally inconclusive with investors stewing over whether the economy is in some sort of sustained recovery or it still has problems longer term.


            On the other hand, the dollar continues to get hammered, trading below both moving averages, in an intermediate term downtrend and nearing the lower boundary of its long term trading range.  This group of investors don’t appear to be buying the strong recovery, higher interest rate scenario.


            Meanwhile, GLD is recovering, spiking through both moving averages and the upper boundary of a very short term downtrend.  Again the pin action suggests lack of conviction in a strong recovery, higher interest rate scenario.


    Fundamental

       Headlines

            The week of December 18:

            The economic data was mixed though the primary indicators were positive by a margin of one (five versus four).  Still this keeps the economy on a path of recovery.  However, I think that the order of magnitude remains an issue.  If you listen to the main stream media, you would think that the economy is exploding to the upside and that is just not the case.  That said, I will take a modest improvement to no improvement any day.

            Of course, the big fiscal event was the passage of the tax cut legislation.  My conclusion on the final version hasn’t changed from prior editions, i.e. it is not simpler, fairer or economically stimulative.  However, it did arouse the animal spirits of not just the Markets but also of corporate America.  I really hadn’t expected the reaction of such giants as ATT and Boeing in announcing their intention of sharing a portion of their tax cut with employee.  In that sense, if a number of corporations follow suit (they have), the result of the bill does become fairer.  I had noted previously that an improvement in sentiment among businesses and consumers could itself push economic activity higher; and seems to be occurring, at least in the short term.  That said, I also noted that we are not really going to know the consequences of this legislation on the economy for at least three and possibly six months.  So we will just have to wait to see the results.  In the meantime, my Market opinion hasn’t changed and that is that even if the tax reforms impact on the economy is better than my forecast, it is already well discounted in equity prices.

            So much for simpler (medium):

            The other fiscal matter that congress managed to take care of was keeping the government open for another couple of weeks.  That keeps spirits high through the holidays; but there are some serious issues that have to be resolved to get a new budget not the least of which is reconciling the tax cut with the mandate in the current budget resolution of no additional deficit spending.  Settlement of this issue will likely cause some heartburn.

            The week of December 25: 

            Again, in total, the indicators were mixed.  However, this time there were no primary indicators.  I am tempted to not even score the week; but there were enough datapoints (eleven) to provide a meaningful read.  So the score is now: in the last 116 weeks, thirty-nine were positive, fifty-six negative and twenty-one neutral.  My bottom line: the economy is improving from a period of stagnation.  The question is the magnitude and length of the recovery. 

            Everyone was on vacation last week, so nothing in the fiscal monetary policy realm.  However, this week congress has to start dealing with the budget (deficit) which should make for interesting headlines.
           
            ***overnight, the December German unemployment rate hit a record low.

       Investing for Survival
   
            The end of stock picking?
           
    News on Stocks in Our Portfolios
 
            Johnson & Johnson (NYSE:JNJ) declares $0.84 quarterly dividend, in line with previous.

Economics

   This Week’s Data

            The December Markit PMI manufacturing index came in at 55.1 versus expectations of 55.0.

            Weekly mortgage applications were off 2.8% while purchase applications were up 1.0%.

   Other

            Another blow to the credibility of Chinese economic data (medium):

            Update on the Baltic Dry Index (short):


Politics

  Domestic

  International

            This is a good summation of the recently unveiled Trump doctrine (medium):

            A lessening of tensions on the Korean peninsula (medium)?

Visit Investing for Survival’s website (http://investingforsurvival.com/home) to learn more about our Investment Strategy, Prices Disciplines and Subscriber Service.