The Morning Call
6/30/26
The
Market
Technical
Monday in the
charts.
Summary:
Dip-buyers filled their boots with big-tech bouncing today after
last week's record
selling with Nasdaq leading the charge (0-DTE faded the initial
move then squeezed to cover). Bonds and the dollar did nothing as oil
rallied (tit-for-tat strikes and no talks). Bitcoin up (choppy) but
gold down. After last week's shitshow, and amid a holiday-shortened summer
week's low liquidity, Nasdaq led the charge today with a dramatic rebound.
Small Caps lagged but all the US Majors closed green on the day... Goldman Sachs' traders noted
that investors paused their demand for pick-and-shovel
(components/chips) and re-engaging with hyperscalers and Software
along for the ride after four straight weekly declines... breadth was so weak... While the S&P 500 P/E has
recently declined, Goldman's Sentiment Indicator of equity investor
positioning rose to 2.0, the highest reading since December 2024... No macro today but higher oil
prices lifted rate-hike odds modestly.. Finally, some potential good
news as the Q2
earnings season is nearly upon us, and AI and hyperscaler capex will remain an
important theme. Notably, the S&P 500 21% return over the past 12
months has been driven entirely by earnings, and Goldman thinks the
combination of a solid macro backdrop plus the ongoing AI investment boom
should lead to another quarter of strong earnings results, despite an elevated
hurdle set by analyst estimates.
Monday in the
technical stats.
https://www.barchart.com/stocks/momentum
https://www.barchart.com/stocks/market-performance
https://www.barchart.com/stocks/sectors/rankings
https://www.barchart.com/stocks/signals/new-recommendations
Trillion dollar borrowing binge lifting
stocks to risky levels.
Goldman indicator
most stretched since 2024.
Summary:
GS US Equity Sentiment Indicator of investor positioning is exploding to a
level we have not seen since 2024. What happened? Just as a reminder, here's
what the indicator tracks: "The Sentiment Indicator combines 9 measures
of positioning across institutional, retail, and foreign investors and has
historically been a statistically significant signal for near-term S&P 500
returns."
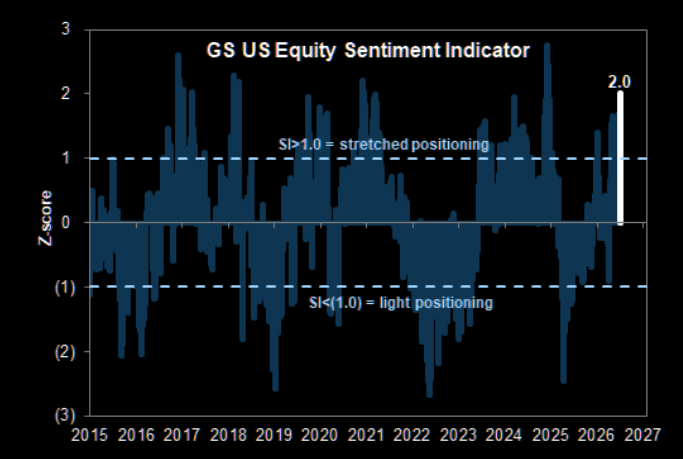
Source: Goldman
Is oil running out
of sellers?
Tuesday morning
setup: US index futures erased an earlier gain following some belligerent Iran headlines
but are still set to end a quarter that is set to be the S&P
500’s best in six years with markets behaving as though period-end dynamics
have now completed. As of 8:30am, the S&P 500 was flat, pointing
to a calm finish for the index that has surged 14% since the beginning of
April. Nasdaq futures rose 0.1% erasing a sizable gain earlier, but on
pace to close the quarter with a staggering 24% gain; In premarket trading,
semis are mixed, Mag7 are flat, Cyclicals are generally leading Defensives with
exceptions being Energy (lower) and Healthcare (higher). European stocks
rallied, with gains led by Abivax SA after a clinical-trial update soothed investor
concerns. Chipmakers drove Asian shares higher. JPM says with the major US
holiday coming up, keep an eye on low liquidity moves in the region. Bond
yields reversed an earlier drop to trade higher by 1bp pushing the 10Y yield to
4.39%. The USD is stronger, looking to erase all of yesterday’s losses.
Commodities are stronger with crude flat into today’s US / Iran discussions,
Metals seeing a bid, and Ags outperforming the other commodities complexes.
Today's economic data calendar includes April Case-Shiller home prices (9am),
June MNI Chicago PMI (9:45am, several minutes earlier for subscribers), June
consumer confidence and May JOLTS job openings (10am) and June Dallas Fed
services activity (10:30am). Fed speaker slate empty for the session. Chairman
Warsh participates in an ECB panel event on Wednesday in Sintra
Fundamental
Headlines
The
Economy
US
The
June Dallas Fed manufacturing index was reported at 0.0 versus
estimates
of 2.0.
International
Q1 final UK GDP grew
0.6%, in line; Q1 final business investment was up 0.9% versus +0.7%.
The May Japanese
unemployment rate was 2.5%, in line; May industrial
production was up 0.5% versus +1.1%; May YoY housing starts were up
33.9% versus +31.8%; May YoY construction orders
fell 6.9% versus +8.0%.
May German
retail sales rose 1.1% versus expectations of -0.1%; the June unemployment
rate was 6.3%, in line; June CPI fell 0.3% versus unchanged.
The June Chinese
manufacturing PMI came in at 50.3 versus consensus of 50.1; the June services
PMI was 50.2 versus 49.9; the June composite PMI was 50.6 versus 50.7.
Other
Update on alternative business indicators.
Iran
Overnight news.
Shippers pull back amid renewed fighting in
Middle East.
Monetary
Policy
Last
week, I raised the issue of whether the growth in M2 was (1) a precursor to
inflation and (2) a sign the Warsh was really a dove talking hawkish. Lance Roberts elaborates on the issue, pointing
out that (1) the excessive M2 growth in and of itself does not necessarily lead
to future of inflation but (2) can easily lead to it when confronted with a
highly expansionary fiscal policy [which we clearly have]. In my discussion, I also raised the problem
of a restrictive monetary policy (if Warsh is truly a hawk) and an expansive
fiscal policy (which we have had for an extended period of time) which Roberts
addresses in his analysis.
https://www.advisorperspectives.com/commentaries/2026/06/29/friedman-right-mostly-misquoted
Which rules will the Warsh Fed follow?
Summary:
- The Federal Reserve's new chairman, Kevin
Warsh, plans to convene task forces to review the central bank's methods
and operations, including its communications, balance-sheet policy, and
delivery of price stability.
- Warsh has previously frowned on the idea
of relying more on rules to direct monetary policy, such as the Taylor
rule, which ties the policy interest rate to components like inflation and
unemployment.
- Using a rule, such as a nominal GDP rule,
could help organize and discipline the Fed's judgments and explain its
actions to the public, providing a presumption about changes to the policy
rate and calling for an explanation if the Fed decides to do something
else.
Fiscal
Policy
The
Iran war supplemental spending request is wasteful spending.
https://www.cato.org/blog/iran-war-supplemental-rife-wasteful-spending-should-be-rejected
AI
Bank on International Settlements warns of AI
crash.
AI sales start to justify data center spending
boom.
Summary:
Revenue
from artificial intelligence has reached a tipping point, showing that the
hundreds of billions of dollars tech companies are spending on it may be
economically sustainable.
- Global AI sales, excluding China, reached
$25 billion in the first quarter of 2026, exceeding the industry’s
estimated $21 billion in depreciation costs.
- The margin for error is narrow, with
depreciation charges still consuming more than two thirds of revenue,
leaving a small buffer to cover other costs such as power, labor and
financing.
The
Financial System
Private credit is making bets on consumer debt.
Summary: The private
credit industry was dubbed “shadow
banking” as it took business away from traditional lenders. Buy Now, Pay
Later companies have been referred to as hawking “phantom
debt” that falls outside Wall Street’s typical tracking methods.Now, these
two more opaque corners of finance are overlapping in a big way — and catching
the attention of credit raters, former regulatory chiefs and others on guard
for potential risks as US consumers show mounting signs of strain. Officially known as
“forward-flow agreements,” investing heavyweights like Blue Owl Capital
Inc., KKR & Co. and Elliott Investment Management are
increasingly agreeing to pre-purchase billions of dollars worth of loans before
they’re made, in a bet that consumer assets will outpace returns elsewhere.
That’s been a boon to the likes of Klarna Group Plc, Affirm Holdings
Inc. and PayPal Holdings Inc., offering fuel for the origination machines
at the heart of a business more Americans are embracing. Skeptics are anxious
the model incentivizes churning out more loans to consumers, with some drawing
parallels to the lead up to the subprime mortgage crisis where
originate-to-sell practices detached risk from reward. But participants counter
that originators can retain chunks of the loans they sell — a structure that
reassures private credit buyers who see these short-term consumer assets as a
way to diversify their billions of dollars of longer-term financing agreements.
This much is clear: The strategy is at the intersection of two industries
navigating their own challenges.
Investing
Wall Street’s $270
billion speculation machine.
https://www.zerohedge.com/markets/ai-rout-exposes-wall-streets-270-billion-speculation-machine
Summary:
On the surface, the week’s casualties appeared unrelated. In reality, they
belonged to the same corner of modern markets: products built to let investors
express the hottest trade with more leverage, less friction and greater
frequency. That’s become one of the defining features of this bull market.
Every winning narrative now spawns an expanding ecosystem of investment
products built around the same idea, from leveraged ETFs and options to
digital-asset derivatives and prediction markets. They differ in structure, but
all promise investors a faster, more concentrated or more leveraged way to own
the market’s hottest trade. The category has grown rapidly. Leveraged
ETFs, which use derivatives to deliver multiples of an asset’s daily return,
now oversee more than $270 billion in assets globally, with the US accounting
for more than $200 billion and Asia exceeding $45 billion, according to data
compiled by Bloomberg. As their assets have grown, the funds have become a
bigger source of forced buying and selling, potentially amplifying moves in the
stocks and indexes they track. Barclays estimates rebalancing by US leveraged
ETFs has recently surged to several times its long-term average, creating
mechanical buying and selling flows potentially large enough to influence
broader market trading. Christopher Getter, a portfolio manager at Simplify
Asset Management, says the growing menu of speculative funds can make it easier
to bet on complex companies without fully understanding them. SpaceX, for
example, is valued at levels that assume years of future growth, while its
limited public float and anticipated index inclusion have created technical
forces that can overwhelm traditional valuation metrics.
Be careful of
quantum computing.
https://www.riskhedge.com/outplacement/do-not-be-a-raccoon
The case for value over growth in building.
https://www.apollo.com/wealth/the-daily-spark/the-case-for-value-over-growth
The Market narrative is changing.
https://www.apollo.com/wealth/the-daily-spark/the-narrative-in-markets-is-changing
Burying your head in the sand is not the best
advice.
https://www.tker.co/p/investors-should-not-ignore-forget-unsettling-events
Why are investors holding more cash?
https://awealthofcommonsense.com/2026/06/why-are-investors-holding-more-cash/
Prices still know the future.
https://alphaarchitect.com/impressive-markets-hypothesis/
Crowded trades are not always bubbles.
News on Stocks in Our Portfolios
What
I am reading today
Robotic warfare is shifting the source of
state power.
https://letter.palladiummag.com/p/war-by-other-means
Freedom isn’t just
another word.
https://www.wsj.com/opinion/freedom-isnt-just-another-word-806a54f8
Visit Investing for Survival’s website (http://investingforsurvival.com/home) to learn more about our Investment
Strategy, Prices Disciplines and Subscriber Service.


