The Morning Call
11/2/20
The
Market
Technical
The S&P’s
chart has not changed much from the one that I presented last Thursday. The key technical points remain (1) its last
high was lower than its all-time high, creating the potential that a double top
has been made, (2) it is challenging its 100 DMA [now support; if it remains
there through the close on Tuesday, it will revert to resistance]. It originally challenged this DMA last
Wednesday, then traded back to the line on Thursday (negating the challenge),
then again closed below it on Friday.
However, (1) it opened a huge gap down on Wednesday, which needs to be
filled and (2) while it has made a lower high, it has yet to make a lower
low. So (1) very short term, the S&P
is in a trading range and (2) until it breaks more support levels, I will
continue to believe its long term bias is to the upside as long as the QEInfinity/Forever
is the operative monetary policy.
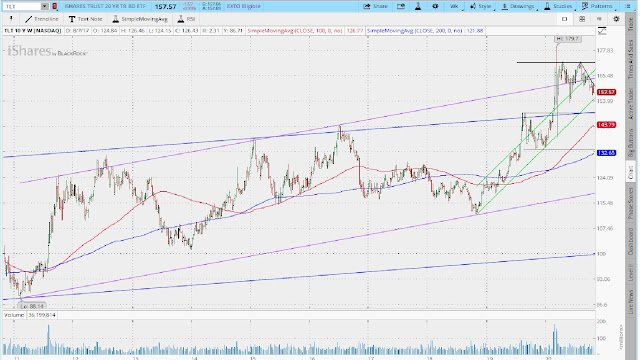
This is a 10 year
look at the long bond. As you can see,
it has developed a series of lower highs and lower lows; so, near term the
trend is lower. That seems
counterintuitive in the midst of uncertainty regarding the economy, the
election and the coronavirus. But it is
what it is; and until proven otherwise the short term trend in prices (rates)
is down (up). That said, TLT is in
uptrends across all timeframes; hence, it can decline further before challenging
even its very short term uptrend. Bottom line, getting too beared up on bond prices
is premature.
http://www.capitalspectator.com/has-the-decades-long-slide-in-treasury-yields-run-out-of-road/
Here is another 10 year chart; this one for
gold. Like TLT, it is in uptrends across
all timeframes. But this chart looks
very different. Indeed, one could make a
decent argument that GLD has reached a cycle peak. Though, it is hard to put heavy odds on that
until it at least pushes below its nearest support levels (100/200 DMA). Nonetheless, I would refrain from any buying
until or if GLD it successfully challenges its former high.
I might as well keep this whole 10 year chart thing
going. This for the dollar. As you can see, it is near the lower boundary
of its intermediate term uptrend---where it recently bounced off of that trend
as well as the lower boundary of its short term trading range and reset its
very short term trend from down to a trading range. That suggests that UUP has seen a low and
further upside is coming.
A
strong dollar, higher bond prices and weak gold prices would make sense in a
faltering economy.
Friday in the charts.
https://www.zerohedge.com/markets/shocktober-stocks-suffer-worst-pre-election-plunge-history
Fundamental
Headlines
The
Economy
Last Two Weeks in Review
The economic
data in the week of October 19th was a bit sparse, but it was upbeat
including one primary indicator. This
past week, the numbers were mixed including the primary indicators (three
positive, three negative). So, the stats
continue to discount any notion of a ‘V’ shaped recovery. And in fact, the Street talk has gone from
‘K’ shaped consensus (i.e. part of the economy performing well while the rest
dismally) to a ‘W’ formation---meaning a short recovery (which we have already
had) and then another period of economic weakness.
https://www.bbc.com/news/business-54723914
Overseas, the
indicators in both weeks were basically mixed.
Of course, the narrative on the coronavirus has turned quite negative in
Europe, suggesting renewed lockdowns---most likely accompanied by a decline in
economic activity. Not helpful to our
own recovery.
Whatever the
shape or magnitude of the near term bounce back, I am not altering my belief
that long term the economy will grow at a historically subpar secular rate due
to the twin burdens of egregiously irresponsible fiscal and monetary
policies---which, by the way, are becoming even more egregiously irresponsible
as a result of measures being taken by the government and the Fed in dealing
with the current crisis.
US
International
The October German
manufacturing PMI came in at 58.2 versus expectations
of 58.0; the EU manufacturing PMI was 54.8 versus 54.4; the UK manufacturing
PMI was 53.7 versus 53.3.
Other
September real disposable income.
The
Fed
Does anyone trust the Fed?
https://www.aier.org/article/does-anyone-trust-the-fed/
China
US/China militaries hold talks.
Bottom line.
How
stock market bubbles form.
https://www.morningstar.com/articles/1007441/a-stock-market-bubble-is-forming
Bracing for a contested election.
https://www.zerohedge.com/markets/wall-street-braces-terrifying-risk-and-20-plunge-just-few-days
The fine line between persistence and
insanity.
News on Stocks in Our Portfolios
Illinois Tool Works (NYSE:ITW) declares $1.14/share quarterly
dividend, in line with previous.
What
I am reading today
Water
ice on the moon may be easier to reach than we thought.
https://www.theverge.com/2020/10/26/21530198/moon-water-ice-sun-cold-traps-nasa-artemis-astronauts
Visit Investing
for Survival’s website (http://investingforsurvival.com/home)
to learn more about our Investment Strategy, Prices Disciplines and Subscriber
Service.


No comments:
Post a Comment