The Morning Call
5/4/26
The
Market
Technical
There is just no quit in this Market. The S&P was up for the week, making a
fourth gap up open on Friday. The technicals remain ‘full steam ahead’ with the
S&P (1) making another new all-time high, (2) above all three DMAs and (3)
in uptrends across all timeframes. The technical question in my mind is how long
can this sprint higher last without a correction?---coupled with the more
fundamental question of the economic impact (growth and inflation) of the war
(destruction of the Middle East oil infrastructure) which is as yet unanswered.
As you know, I approached this upside move
cautiously---which couldn’t have been more wrong. Nonetheless, I am loath to
chase this upswing, especially with (now) four gap up opens
sitting below. The only good news in this trading error is that a number of
stocks on my Buy List have remained within buying parameters. So with any
retreat, I can make a delayed entry.
Should you ‘sell
in May’?
https://www.carsongroup.com/insights/blog/lets-talk-about-sell-in-may/
Goldman warns crash
risk spiking.
Summary:
The clearest implication of narrow breadth for investors is continued Momentum
volatility, which can act as a destabilizer for the market once momentum
reverses. While narrow breadth can persist for months, eventually it resolves
in either a "catch up" or a "catch down” (i.e., meltup of
"everything else" or meltdown of the handful of "market
generals"), with both outcomes consistent with Momentum
volatility. The Goldman strategist warns that the bank's Prime data shows hedge
fund net tilt to Momentum ranks near a multi-year high. In addition,
while hedge fund gross leverage has declined during the last couple weeks, it
remains elevated relative to history, ranking at the upper end of the 5-year
range. In short, the longer this narrow-breadth meltup persists, the
greater the risk of a sharp, violent drawdown (to avoid the
more popular term crash).

TLT was down on
the week and is nearing the lower boundary of its very short term trading
range. And it remains below all DMAs and in downtrends across all major
timeframes. With stagflation the likely result of the
destruction wrought on the oil infrastructure, I am hard pressed to think that
bond prices are going to improve markedly.

Gold reset its 100
DMA to resistance. It remains in a very short term downtrend marked by the top
and now two lower highs. I am watching to see if it makes a second higher low
or continues its downward momentum. The good news is that it (1) remains in
uptrends across all time frames and (2) still has one gap down open overhead
that needs to be filled. I will likely rebuild my GDX position when it breaks
through that very short term downtrend.
Silver on the
verge.
https://www.zerohedge.com/the-market-ear/silver-verge-one-push-away-squeeze
Summary:
Silver just printed its biggest up candle in a while and is pressing against a
large wedge/triangle formation. A close above the 50-day MA (roughly another
dollar) could open the door to a squeeze.

The dollar failed to sustain its upward momentum, could not
challenge its 50 and 200 DMAs (both remain resistance) and now challenging its
100 DMA to the downside. The good news is that it has two gap down opens
overhead that needs to be filled. That said, I continue to believe that the
macroeconomic backdrop of the US economy (slow growth and rising inflation)
suggests a low to lower dollar.

Friday in the
charts.
Summary:
A new day, a new month... and another record high on negative
breadth. With even Goldman
warning that bad things happen when only a handful of high momentum
names carry the entire market (especially to now daily all-time highs)
while most stocks drop, the S&P decided to demonstrate and closed at a
fresh record high on yet another day of brutal negative breadth - this
was the 4th record high of the past 5 that saw way more decliners (328) than
advancers (172)!
Friday in the technical stats.
https://www.barchart.com/stocks/momentum
https://www.barchart.com/stocks/market-performance
https://www.barchart.com/stocks/sectors/rankings
https://www.barchart.com/stocks/signals/new-recommendations
Monday morning
setup: US futures whipsawed and crude oil spiked higher as tensions flared up
again in the Middle East, taking the focus off a run of strong earnings by
megacap tech companies. As of 8:00am ET, S&P and Nasdaq 100 futures dropped
0.2% from Friday's record highs, falling as much as 0.5% just minutes earlier
after Iran’s Fars agency claimed two missiles hit an American patrol
boat, before erasing most of the declines after the US denied a ship was
hit. All of this after Trump said Sunday that US Navy will guide ships
out of the Strait of Hormuz from Hormuz in a move called “Project Freedom"
while Iran issued Trump a one-month deadline for negotiations on its
proposed 14-point deal to reopen the Strait of Hormuz. European stocks were
mostly red while tech-heavy Asia indexes in South Korea and
Taiwan surged in Monday trading. In premarket trading, Mag 7
names are mixed: GOOGL (+0.6%), AMZN (+0.6%), and META (+0.7%) are outperforming,
while AAPL and MSFT are lower. Brent crude surged more than 5% to trade above
$113 a barrel before paring the gain, while bitcoin and gold traded in a mirror
image. Interest rates are higher with the 10Y yield rising 4bps to 4.41%; WTI
crude added ~$2 to $104 this morning having briefly traded above $107; base
metals are higher, while gold and silver both sliding more than 2%. Looking at
the US economic data calendar slate includes March factory orders at 10am. Fed
speaker slate includes New York Fed President John Williams at 12:50pm
Fundamental
Headlines
The
Economy
The
US stats tilted to the positive side last week though the primary indicators
were balanced (five plus, three neutral, five negative) of which there was one
neutral and two negative price reports. Overseas, the data was very
disappointing for a second week in a row although there were two positive and
one neutral inflation readings.
We
still aren’t seeing any economic effects of the Iran war and the turmoil in the
private credit market in the US numbers though perhaps the last two week’s
global data is the first sign---and that makes sense to me especially with
respect to economic growth since it is more heavily dependent oil availability.
On
the other hand, somewhat surprisingly, the inflation data in the US was poor
while overseas the numbers were upbeat. That said, given the ongoing
constrained oil supply and the damage to the global oil producing
infrastructure my guess is that these statistics will only get worse.
Inflation is rocking and rolling.
There
were no new incidents of private credit deterioration. Though clearly that
doesn’t mean that there won’t be. Nonetheless, most of the analysis (which I have
linked to) suggests that while there could be some negative fallout from this
problem, it is unlikely to reach the order of magnitude of the great financial
crisis. In addition, several of the private credit ETFs being bought suggesting
investors are becoming more sanguine.
We
should get some new insights during/following this week’s Milken Conference.
While this all leaves me with heightened concern about both growth and
inflation/stagflation, the stock market is anything but worried. I am not sure
if (1) this is a buy-the
rumor-sell-the-news situation, (2) investors correctly believe that earnings
growth will continue at its current pace irrespective of the damage being done
by the destruction of the Middle East oil infrastructure and I am wrong to be
worried or (3) investors incorrectly believe earnings growth will continue at
its current pace irrespective of the damage being done by the destruction of
the Middle East oil infrastructure I am right to be worried.
Color me clueless. But until the magnitude of the war’s economic impact on
the US economy becomes clearer, my choice is to stay on the sidelines even if I
am proven wrong to be worried.
US
The April final manufacturing PMI was 54.5
versus consensus of 54.0.
https://www.advisorperspectives.com/dshort/updates/2026/05/01/sp-global-manufacturing-pmi-april-2026
The April ISM manufacturing index was 52.7
versus projections of 53.0.
International
The April final EU manufacturing PMI was
52.2, in line.
Other
March median household income.
https://politicalcalculations.blogspot.com/2026/05/median-household-income-in-march-2026.html
Update from my favorite optimist.
http://scottgrannis.blogspot.com/2026/04/m2-update-still-looking-like-inflation.html
Counterpoint.
(3)
13 Week Money Supply Growth is Trending Above 5%
Update from a not so optimistic Econobrowser.
https://econbrowser.com/archives/2026/04/a-worried-econ-watcher
Update on big four recession indicators.
https://www.advisorperspectives.com/dshort/updates/2026/04/30/the-big-four-recession-indicators
Iran
Overnight news.
Monetary
Policy
The
Fed is setting policy off of a partisan mood ring.
Major central banks are cautious.
https://www.zerohedge.com/markets/final-warnings
The
Dollar
Where is the de-dollarization?
Investing
The latest from
BofA.
https://www.zerohedge.com/markets/hartnett-enjoy-boom-loop-event-could-open-door-doom
Summary:
stocks & commodities love nominal booms (long the Cs - commods,
chips, consumer, China), bonds (steeper curve) &
US dollar not so much. Hartnett next look at this week's "tale of the
tape", where understandably the main event is the ongoing “boom
loop” as policymakers counter deglobalization, populism, and
inequality... with max govt spending (up
60% since 2020 and set to rise 15% in proposed FY27 budget), play
geopolitics via inflationary trade, industrial, and financial market policies
to monopolize supply of chips, oil, rare earths, minerals needed to win AI war The
only thing that breaks 2020s boom loop, Hartnett thinks, is bond collapse.
And speaking of a bond
collapse, Hartnett concludes the note with his "The Price is Right"
section, where the BofA strategist says that while 5% is the “Maginot
Line” for 30-year Treasury, he expects it to hold.
The biggest bubble
of modern times.
(3)
Stocks Now In “The Biggest Bubble Of Modern Times”
Why countries are
stocking up on gold.
The permanent distortion theory.
(3)
The Permanent Distortion Theory - by Quoth the Raven
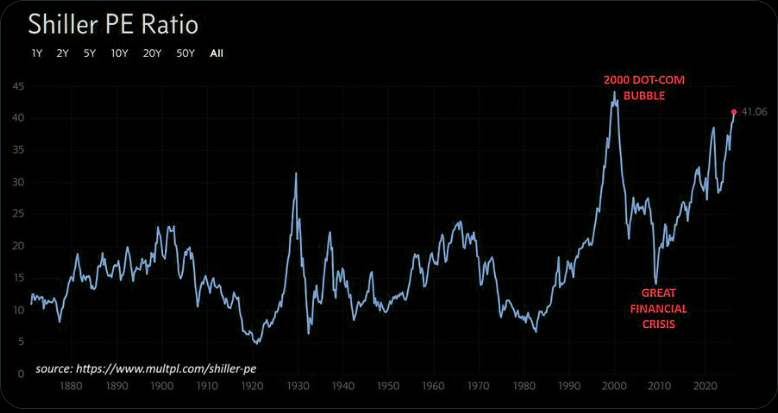
The S&P 500
Shiller PE just hit 41x. The only time it's been higher was December 1999,
right before the dot-com crash.
News on Stocks in Our Portfolios
What
I am reading today
Notes for self-education.
https://jillianhess.substack.com/p/richard-feynmans-notes-for-self-education?ref=thebrowser.com
Visit Investing
for Survival’s website (http://investingforsurvival.com/home)
to learn more about our Investment Strategy, Prices Disciplines and Subscriber
Service.
No comments:
Post a Comment