The Morning Call
1/14/19
The
Market
Technical
The
S&P was down fractionally on Friday.
Notice that it has struggled the last few trading days, unable to push
above a former support level (purple line).
It is also facing resistance from the upper boundary of its short-term
downtrend and the 61.8% Fibonacci level (a significant retracement [resistance]
level). It remains solidly below both
MA’s, with the 100 DMA about to push below its 200 DMA (a negative). Finally, breadth is rolling over. The one bright spot is that it still trades
within a very short-term uptrend. These
indicators suggest that short term weakness.
Whether that is a retreat in a developing uptrend or the last gasp
before challenging its December low remains to be seen.
And:
The
long bond was up 3/8 %, ending above both MA’s, in a very short-term uptrend, a
short-term trading range and appears to have failed to challenge its prior
higher low. That keeps this chart
strong, suggesting that rates have peaked, at least, short term.
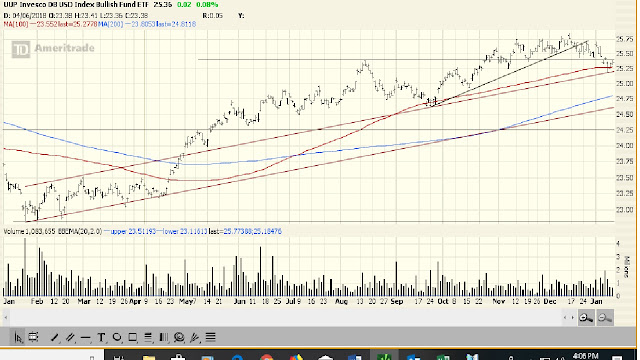
The
dollar was up again on Friday though not by much. Still it remains above both MA’s and it a short-term
uptrend, though it has struggled to make a new high of late. This performance suggests investors are
either betting that the US is going to be the strongest economy in a coming
global slowdown or that interest rates are going up---which I doubt.
The
GLD chart has gone from being ugly to, at least, tolerable. It remains above both MA’s, in a short-term
trading range and well above the lower boundary of a very short-term
uptrend. This pin action would be
compatible with lower rate/weaker economy scenario.
The
VIX had a much bigger down day on Friday than I expected on small down Market
day. Of course, it has not fallen nearly
as much as I anticipated on several recent large down day. So, it appears that there is some catch up in
the pin action. As you can see, it ended
below (1) the lower boundary of its very short-term uptrend [if it remains
there through the close today, the trend will be voided] and its 100 DMA [now
support; if it remains there through the close on Tuesday, it will revert to
resistance]. While it remains above its
200 DMA and in a short-term uptrend, the VIX’s chart is threatening to
deteriorate which would be a plus for stocks.
Fundamental
Headlines
Jeff
Gundlach: we are swimming in an ocean of debt.
Goldman
lowers its 2019 profit growth forecast.
News on Stocks in Our Portfolios
Economics
This Week’s Data
US
International
December Chinese exports fell
4.4% versus expectations of a rise of 2.2%; imports dropped 7.6 versus
estimates of a 3.4% increase.
November
EU industrial production declined 3.3% versus forecasts of down 2.1%.
Other
What
I am reading today
Quote of the day.
France and
Germany merge economic and defense polices---something Hitler could not do.
Visit Investing
for Survival’s website (http://investingforsurvival.com/home)
to learn more about our Investment Strategy, Prices Disciplines and Subscriber
Service.


No comments:
Post a Comment