Tuesday, May 31, 2016

Tuesday Morning Chartology

The Morning Call

5/31/16
The Market
         
    Technical

       Tuesday Morning Chartology

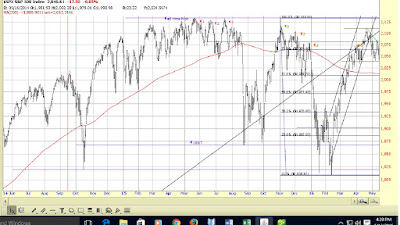
            The S&P soared last week, cutting through that very short term downtrend like a hot knife through butter.  We now await a challenge of the upper boundary of its short term trading range.


            The long Treasury continues to struggle in a fairly tight trading range.  With all the talk of an increasing Fed Funds rate, you would think that it would have moved to the downside.


            GLD took out its short term uptrend with little difficulty, is now challenging its 100 day moving average and is about to challenge the newly reset lower boundary of a short term trading range.  If both those challenges are successful, the run is GLD may be over.


            The VIX is making another run at the lower boundary of its short term trading range.  If it can successfully challenge it, we could be in for a fun summer.  Otherwise, this recent rally may come of a screeching halt.


    Fundamental

       Headlines

            US economic news slipped back into the negative column last week: above estimates: April housing starts, weekly mortgage and purchase applications, the April trade balance, April durable goods orders and weekly jobless claims; below estimates: May Markit manufacturing and services PMI’s, month to date retail chain store sales, the May Richmond and Kansas City Fed manufacturing indices, revised first quarter GDP and May consumer sentiment; in line with estimates: April durable goods orders, ex transportation and first quarter corporate profits.  The primary indicators were ever so slightly positive: April housing starts (+), April durable goods orders (+) though April durable goods, ex transportation was in line, and revised first quarter GDP (-).  Overall, I am going to rate this a neutral week, making the current score: in the last 37 weeks, nine have been positive to upbeat, twenty six negative and two neutral.

            That makes three weeks in a row that the numbers have been neutral to positive.  That is hardly a trend but it is a sufficient enough divergence from the overall pattern of the last nine months to beg the question of whether or not the US economy has ceased weakening.  The answer is that it is too soon to tell but the yellow is now flashing.  However, if the economy is starting to gain some traction, that would clearly be a big plus. But it would no way suggest that the US economy is about to return to its historical secular growth rate.  It remains burdened by too much government spending, too many taxes, too much regulation and a Fed that is way too impressed with its ability to control the economy.

            ***overnight, May EU inflation remained negative (-0.1%) while April Japanese factory output, household spending and job availability were better than expected.

            Of course, last week’s big news was the apparent hawkish turn of the Fed, including Yellen, implying a June or July rate increase.   And that seemed to be the driving force behind the Market moonshot.  The reasoning for all this jigginess, as I read the Market gurus, is that the Fed is moving now because the economy is so awesome but in case it’s not, the Fed will have more room to cut rates---which seems to lack some logic.  First of all, while the last three weeks of data have been decent and three weeks is at least a semblance of trend, I am not sure that sufficient to declare the economy on an upward trajectory strong enough (even in the Fed’s model) to warrant a rate hike.  Second, if things are so peachy, why already start worrying about the economy rolling over?

            I suspect that the real reason was that the Fed, knowing that it has itself in a box, tested the waters again on a rate hike and when the Market response was favorable (since the Market has been the only piece of data dependency upon which the Fed has relied), everyone on the FOMC went all in for an increase in rates.

            All this nonsense aside, my thesis remains that QE did little to help the economy so its absence will do little harm; however, QE was the primary fuel for the gross mispricing and misallocation of assets, hence, its absence will likely have a profound impact on asset pricing.

            Thoughts from Sam Zell (medium):

            Warning from the yield curve (medium):

        Subscriber Alert

            The price of FMC Inc. (FMC) has risen above the upper boundary of its Buy Value Range and, hence, is being Removed from the Dividend Growth Buy List.

            The price of AmeriGas Ptrs (APU) has risen above the upper boundary of its Buy Value Range and, hence, is being Removed from the High Yield Buy List.

       Investing for Survival
   
            What is risk?

    News on Stocks in Our Portfolios
 
Medtronic (NYSE:MDT): FQ4 EPS of $1.27 beats by $0.01.
Revenue of $7.57B (+3.7% Y/Y) beats by $80M

Bank of Nova Scotia (NYSE:BNS): FQ2 EPS of C$1.46 beats by C$0.03.
Revenue of C$6.59B (+10.9% Y/Y) beats by C$150M.

Economics

   This Week’s Data

            April personal income rose 0.4%, in line; personal spending was up 1.0% versus expectations of up 0.7%; the core PCE price index was up 0.2%, in line.
           
   Other

            China getting more aggressive in yuan devaluation (medium):

            The failure of negative interest rates (medium):

            Quote of the day (short):


            Here we go again---free money to those who can’t pay it back (medium):

Politics

  Domestic

  International War Against Radical Islam


Visit Investing for Survival’s website (http://investingforsurvival.com/home) to learn more about our Investment Strategy, Prices Disciplines and Subscriber Service.


Monday, May 23, 2016

Monday Morning Chartology + rehash of last week

The Morning Call

5/23/16

Even though I have been AOL for the last two weeks, I have decided that a little beach time is in order.  So I will be gone this week, back on 5/31.  As always, I will have my computer and will stay in contact if events warrant.

The Market
         
    Technical

       Monday Morning Chartology

            The S&P is in a very short term downtrend and is hovering above the lower boundary of its short term trading range which also is very near the neckline of the developing head and shoulders.  As long as that level holds, my focus is on the upside.  A break and we need to start looking for support.


            The long Treasury continues its sideways trading---likely reflecting investor uncertainty over the economy and Fed policy.


            Gold took a hit last week as the odds of a June rate hike increased.  This chart will change at the close today, absent a big recovery.  The Fibonacci level immediately below current prices will become an even more important support level.


            The VIX continues to trade like it has made a bottom---not good for stocks.


    Fundamental

            Last week’s economic data was something of a mixed bag; but overall, I score it as a plus.  First, overall, the numbers were negative: above estimates: April existing home sales, April industrial production and April housing starts; below estimates: the May Philly and NY Fed manufacturing indices, weekly mortgage and purchase applications, weekly jobless claims, month to date retail chain store sales, April CPI and the May housing index; in line with estimates: the April/March leading economic indicators and the April Chicago national activity index.

            However, the primary indicators were not only numerous but largely upbeat: April existing home sales (+), April industrial production (+), April housing starts (+) and April leading economic indicators (0).  The score: in the last 36 weeks, nine have been positive to upbeat, twenty six negative and one neutral.

Clearly this was the strongest week for this data set in the last eight months; and it follows on another positive week.  While this performance is not enough to alter a forecast, it is certainly sufficient to put me on alert that the US may avoid a recession after all.

Overseas, April Chinese credit growth, industrial production, retail sales and fixed asset investment came in below estimates while housing prices soared (not a good combination) and first quarter Japanese GDP came in better than expected.  So little help for our economy from abroad.

***overnight, April Japanese PMI was below forecast while the EU flash PMI was the lowest in sixteen months.  In addition, the US issued another warning to Japan to cease intervening in the currency markets.

            Of course, even if the US does miraculously escape a downturn that still wouldn’t change the underlying theme of our forecast for the last five years: a sluggish economy held back by too much government spending, too high taxes, too much regulation and a Fed that couldn’t find its own ass with a pair deer antlers.

            And speaking of the Fed (and I wish that I weren’t), it did more of its bobbing and weaving last week with several members emphasizing that a June rate hike was on the table.  I don’t know if you are tired of the on-the-one-hand, on-the-other-hand unproductive mewing, but I sure am. 

My bottom line here is that I still don’t think that a rate increase is going to happen: but even if it does, it will have only a minor impact on the economy.  I have said this repeatedly, but I will again: (except for QE1), all the money that the Fed has thrown at the economy has done very little to improve it, so its absence will do very little to harm it. 

Even if the economy does manage to stay on the plus side, (1) it will be more about the productivity and hard work of American businesses and labor than a bunch of ivory tower eggheads who have achieved an excessively overrated reputation with the media and (2) it won’t be a plus by much and will still be unable to grow at historical rates as a result of all the aforementioned problems, not the least of which is the Fed.

That said, I will repeat the second part of my thesis; which is that because all the QE’s have had an enormously positive effect on the Market (the mispricing and misallocation of assets), tighter money will likely have an equal and opposite impact on it.    So if the Fed does take another step in June to normalize rates, fasten your seat belts because the ride is about to get rough.  The big question is, will the Market decline make economic conditions worse?
           
       Investing for Survival
   
            180 years of market drawdowns.   

           
    News on Stocks in Our Portfolios
 
Economics

   This Week’s Data

   Other

            New info on the oil glut (medium):

            Rising risk of a trade war (medium):

Politics

  Domestic

Occupation most cited in Panama Papers (medium):

  International War Against Radical Islam


Visit Investing for Survival’s website (http://investingforsurvival.com/home) to learn more about our Investment Strategy, Prices Disciplines and Subscriber Service.


Thursday, May 19, 2016

The Morning Call--More confusion from the Fed

The Morning Call

5/19/16
The Market
         
    Technical

The indices (DJIA 17526, S&P 2047) had a volatile day courtesy of the Fed but ended basically unchanged on the day.  So they remained close to the lower boundary of their short term trading range which also happens to be the neck line of a head and shoulders formation.  Volume fell and breadth continued weak.   The VIX was up another 2.5%, ending within short and intermediate term trading ranges and drew ever nearer to its 100 day moving average.  If it breaks above that MA, it would not bode well for stocks.

The Dow closed [a] above its 100 day moving average, now support, [b] above its 200 day moving average, now support, [c] within a short term trading range {17498-18736}, [c] in an intermediate term trading range {15842-18295} and [d] in a long term uptrend {5541-19413}.

The S&P finished [a] above its 100 day moving average, now support, [b] above its 200 day moving average, now support, [c] in a short term trading range {2039-2110}, [d] in an intermediate term trading range {1867-2134} and [e] in a long term uptrend {830-2218}. 

The long Treasury (down 1.3%), along with virtually every other fixed income security, got banged hard on heavy volume (as a result of the more hawkish sounding FOMC minutes released yesterday afternoon), ending below the upper boundary of a very short term downtrend, pushing through a key Fibonacci support level and approaching its ascending 100 day moving average.  A break below that MA would indicate growing momentum to the downside (higher interest rates).  It did stay within a short term uptrend.

GLD was also hit hard (and for the same reason as the TLT), bouncing down off a key Fibonacci level and breaking below the lower boundary of a very short term uptrend---neither very positive.  It did manage to stay within its short term uptrend as well as above its 100 day moving average. 

Bottom line: both of the Averages remain near a challenge of the lower boundaries of their short term downtrends. If those levels can’t hold, my attention will shift from resistance levels to support levels.  Bonds and gold got whacked hard on the prospect of a June Fed rate hike.  If that notion gains any traction, then I will likely sell a portion of the GDX holding in the Aggressive Growth Portfolio.

            More on sell in May (medium):

    Fundamental

       Headlines

            Only one datapoint was released yesterday: weekly mortgage and purchase applications which were down.  It is a minor indicator, so there is little of significance to this as a stand-alone number.

Overseas, first quarter Japanese GDP came in better than expected; April Chinese housing pricing soared 12.4% year over year (can you say ‘bubble’?) both of which provided added ammo to the notion of an improving economic outlook which gained some traction on Tuesday with the better housing and industrial production stats and the hawkish statements by two Fed officials.

Now comes the release of the minutes from the last FOMC meeting which read a good deal more hawkish than the Fed statement following that meeting.  That said, there were still a lot of if’s, and’s and but’s in the commentary.  Enough so, that there could be no June hike and the Fed could green apple two step its way to seeming consistency. 

All that said, putting the data, the Fed official comments and the Fed minutes together and suddenly investors are seemingly worried about a June rate hike.  I say seemingly because stocks sold off immediately following the release of the minutes, then rallied back to flat on the day.  Where the panic really showed up was in the fixed income and gold market.  

            I am going to make no claims to any kind of accurate interpretation of yesterday’s confusing intermarket price movements.  In fact, I am not sure there is one.  In addition, two of the more dovish Fed members speak today and Yellen will make public comments twice before the next Fed meeting.  So there is plenty of room for more of the usual on-the-one-hand, on-the-other-hand mewing that ultimately leads to nothing.  

So until we get something more concrete than two weeks of positive data and a weeks old Fed minutes, I remain in the camp believes that the Fed doesn’t have the cojones to raise rates in June because only someone that is ADD could believe that the economy is doing great based on those two indicators.  Plus, in my opinion, for the Fed to raise rates, it would have be very secure in its own mind that Brexit won’t occur next month.  I remain open to altering that opinion when the facts change; but so far, they haven’t changed enough.

            China’s reaction (short):

Bottom line: as far as the Markets go, I will, as usual, wait to see (1) any follow through in the bond and gold markets before I start disturbing positions there and (2) some resolution to yesterday’s see saw performance of stocks.  In the meantime, cash is a wonderful thing.

            More on valuation (medium):
      
Economics

   This Week’s Data

            Weekly jobless claims fell by 16,000 versus expectations of a 19,000 decline.

            The May Philadelphia Fed manufacturing index was reported at -1.8 versus estimates of +3.0.

            The April Chicago Fed national activity index came in at +10; however, the March reading was revised down from -44 to -55.

   Other

            The cost of regulation (medium):

Politics

  Domestic

  International War Against Radical Islam


Visit Investing for Survival’s website (http://investingforsurvival.com/home) to learn more about our Investment Strategy, Prices Disciplines and Subscriber Service.


Wednesday, May 18, 2016

The Morning Call---OK, everything isn't awesome

The Morning Call

5/18/16

The Market
         
    Technical

Well darn, the indices (DJIA 17529, S&P 2047) just couldn’t muster any follow through from Monday’s strong performance.  Both ended close to the lower boundary of their short term trading range which also happens to be the neck line of a head and shoulders formation.  Volume rose and breadth deteriorated.   The VIX jumped 6%, ending within short and intermediate term trading ranges but is very close to breaking above its 100 day moving average.  If that occurs, it would not bode well for stocks.

The Dow closed [a] above its 100 day moving average, now support, [b] above its 200 day moving average, now support, [c] within a short term trading range {17498-18736}, [c] in an intermediate term trading range {15842-18295} and [d] in a long term uptrend {5541-19413}.

The S&P finished [a] above its 100 day moving average, now support, [b] above its 200 day moving average, now support, [c] in a short term trading range {2039-2110}, [d] in an intermediate term trading range {1867-2134} and [e] in a long term uptrend {830-2218}. 

The long Treasury rose but continues to struggle, ending below the upper boundary of a very short term downtrend, but within a short term uptrend, over its 100 day moving average and a key Fibonacci support level.

GLD was up, closing within very short term and short term uptrends as well as above its 100 day moving average.  It is also about to challenge a key Fibonacci level.  If that is successful, it seems like a sure bet that it will challenge the upper boundary of its intermediate term trading range.

Soros adds to his gold holdings (short):

Bottom line: both of the Averages are nearing a challenge of the lower boundaries of their short term downtrends. If those levels can’t hold, my attention will shift from resistance levels to support levels.

    Fundamental

       Headlines

            We got more upbeat economic news yesterday: April housing starts were much better than expected, though building permits were worse, April industrial production was stronger than anticipated.  Housing starts and industrial production are also primary indicators, making yesterday a very strong data day indeed.  Nonetheless, it did have its negatives: April CPI was up more than estimates, month to date retail chain store sales showed a marked decline in growth from the prior week.  In addition to the aforementioned April building permits.  So if you are hoping that the US avoids a recession, yesterday was a breath of fresh air.

            That said, skeptics remain (medium):

            And, picturing the economy (medium):

            Unfortunately, the international stats continue to disappoint.  April UK inflation was below forecasts as was first quarter French GDP; though the French debt to GDP was higher than expected.

            ***overnight, first quarter Japanese GDP came in better than expected; April Chinese housing pricing soared 12.4% year over year (can you say ‘bubble’?)

            Of course, if you are among the euphoric crowd of easy money devotees, yesterday was a bummer: strong economic data and a higher CPI than consensus are not the stuff of more QE.  And just to make life really miserable, two Fed officials said that a June rate hike was still on the table.  I don’t for a second believe these guys (and gal) will do it---at least not as long as their primary goal is to keep the Markets buoyed.  But those comments make for good rhetoric and keep alive the notion that the Fed is seriously debating the transition to normalized monetary policy---when in fact they are wee weeing in their pants that the Markets might really believe that they intend to normalize Fed policy.

            Bottom line: OK, so maybe everything isn’t awesome; in particular if you are one of those lemmings that believe that as long as the global economy is weak then the global central banks will keep the QE musical chairs game going.  I have said this before but I will repeat it:  this situation is not going to end pleasantly.  Either the central banks become convinced that the global economy is improving and they start ramping up rates which hammers the algos and carry traders (and likely leads to a recession since it is highly probable that the global economy isn’t improving).  Or the global economy isn’t improving and those same central bankers sit and watch as conditions worsen because everything they have tried and keep trying hasn’t worked; indeed, they have only made things worse (and sooner or later those aforementioned lemmings figure this all out).  So its dealer choice.  Either a global recession brings a Market decline or a Market decline brings global recession.

I continue to believe that cash may be the most valuable asset in your portfolio.  Adding to it by selling a portion of your winners makes a lot of sense.

            The latest from John Hussman (medium):
           
    News on Stocks in Our Portfolios
Hormel Foods (NYSE:HRL): FQ2 EPS of $0.40 beats by $0.01.
Revenue of $2.3B (+0.9% Y/Y) in-line
 
Economics

   This Week’s Data

            Month to date retail chain store sales growth was below the level of the prior week.

            April industrial production rose 0.7% versus estimates of up 0.2%.

            Weekly mortgage applications declined 1.6% while purchase applications fell 6.0%.

   Other

Politics

  Domestic

  International War Against Radical Islam

            Senate passes bill that would lead to investigation of Saudi’s role in 9/11 (medium):

Visit Investing for Survival’s website (http://investingforsurvival.com/home) to learn more about our Investment Strategy, Prices Disciplines and Subscriber Service.


Tuesday, May 17, 2016

The Morning Call--Everything is awesome

The Morning Call

5/17/16

The Market
         
    Technical

The indices (DJIA 17710, S&P 2066) rallied hard off of last week’s disappointing performance, though volume was flat and breadth mixed.   The VIX fell 2.5% but that was actually less than I would have thought; it continues to act as if it has made a bottom.

            The VIX is too low (short):

The Dow closed [a] above its 100 day moving average, now support, [b] above its 200 day moving average, now support, [c] within a short term trading range {17498-18736}, [c] in an intermediate term trading range {15842-18295} and [d] in a long term uptrend {5541-19413}.

The S&P finished [a] above its 100 day moving average, now support, [b] above its 200 day moving average, now support, [c] in a short term trading range {2039-2110}, [d] in an intermediate term trading range {1867-2134} and [e] in a long term uptrend {830-2218}. 

The long Treasury fell, ending back below the upper boundary of a very short term downtrend, but within a short term uptrend, over its 100 day moving average and a key Fibonacci support level.

GLD was up, closing within very short term and short term uptrends as well as above its 100 day moving average.  It is continuing to eye the upper boundary of its intermediate term trading range.

Soros adds to his gold holdings (short):

Bottom line: despite all the jubilation yesterday, the move up was on low volume, mixed breadth and left the Averages within very short term downtrends.  As long as they remain above the lower boundaries of their short term trading ranges, the technical damage in minimal.  So I am watching how they behave around those boundaries as well as their very short term downtrends.  
           
    Fundamental

       Headlines

            Yesterday’s US economic news was a downer---the May NY Fed manufacturing index was awful while the NAHB index was just below expectations.  Overseas, the Chinese economy continues to disappoint---to the extent that we know even a rough approximation of the numbers.

            ***overnight. UK inflation came in below expectations, first quarter French GDP was reported below estimates while debt to GDP was reported above.

            Bottom line: so everything remains awesome!  Right?  What could possibly be of concern with the economies of China, Japan, the US and, at least, chunks of Europe slowing, US corporate earnings growth flattening and the possibility of a Grexit or Brexit or both approaching?  But, but, oil prices are up---which we are being told is a major plus by the same group who told us that declining oil prices were a major plus.  And me without my spoon.

            Whatever the bulls are selling, I am not buying.  I continue to believe that cash may be the most valuable asset in your portfolio.

       Investing for Survival
   
            Savings and future returns.
           
    News on Stocks in Our Portfolios
 
Home Depot (NYSE:HD): Q1 EPS of $1.44 beats by $0.09.
Revenue of $22.76B (+9.0% Y/Y) beats by $410M


Economics

   This Week’s Data

            The May National Association of Homebuilders index came in at 58 versus expectations of 59.

            April CPI was up 0.4% versus estimates of up 0.3% while CPI, ex food and energy was in line.

            April housing starts were up 7.6% versus forecasts of up 4.2%

   Other

            The recent history of household net worth (medium):

Politics

  Domestic

Quote of the day (short):

Confessions of a congressman (medium and today’s must read):

  International War Against Radical Islam


Visit Investing for Survival’s website (http://investingforsurvival.com/home) to learn more about our Investment Strategy, Prices Disciplines and Subscriber Service.


Monday, May 16, 2016

Monday Morning Chartology

The Morning Call

5/16/16

I am back but not full speed.  Studying is a drag for a 73 year old and doesn’t go as smoothly as when I was 20.  So I will continue to devote time to studying.  The test is Friday.  I will produce short Morning Calls through Thursday.  Then nothing Friday and Saturday.  Back on Monday if I am sober.

The Market
         
    Technical

       Monday Morning Chartology

            If a picture is worth a 1000 words, then I needn’t say anymore.

            Selling volume continues to expand (medium):


            The long Treasury (132) ended Friday above the upper boundary of a very short term downtrend.  As you can also see, it is not the far away from the upper boundary of its intermediate term trading range.  If it breaks that level, the next stop is the upper boundary of its long term uptrend (circa 150).  Nothing says recession/deflation quite like falling interest rates.


            GLD (121) continues to act well.  It looks like it is going to have another try at the upper boundary of its intermediate term trading range.  If it breaks that the next stop is the upper boundary of its long term downtrend (140).


            The VIX continues to mill around the lower boundary of its short term trading range but has been unable to break below it.  A move out of the very short term trading range that has existed since mid-March would likely lead me to add to the Aggressive Growth Portfolio’s VXX position.


    Fundamental

            Although the economic flow last week was a bit slow, it was nonetheless upbeat: above expectations: the April small business confidence index, month to date retail sales, April retail sales, weekly mortgage and purchase applications, April import/export prices and May consumer sentiment; below expectations: March wholesale inventories and sales, March business inventories and sales, weekly jobless claims and April PPI; in line with expectations: the April budget surplus and April PPI, ex food and energy.  There was only one primary indicator (April retail sales); and it too was up.  The score: in the last 35 weeks, eight have been positive to upbeat, twenty six negative and one neutral.

            We have to take good news anyway we can get it.  But the above performance is hardly a reason to question our forecast.

            Overseas, the data was mixed: above expectations: German April manufacturing orders and first quarter household spending, April Chinese and EU auto sales; below expectations: the April Chinese trade deficit, consumer inflation and wholesale prices and March German industrial production.  Again nothing here to prompt a rethink of our forecast.

            ***overnight, April Chinese credit growth, industrial production, retail sales and fixed asset investment came in below estimates.

            In other matters, I reported that a Japanese official had suggested additional currency weakening monetary measures; and I suggested that it should be taken with a healthy dose of skepticism in light of recent warnings from both the US and Chinese that more competitive devaluations would not be welcome. 

In addition, it is rumored that Abe will delay the implementation of a second (upcoming) sales tax increase.  You may recall that I thought it absurd to effect the first hike.  The Japanese economy is comatose and the last thing it needs is another rise in sales tax.  The measure makes a lot more sense than doubling down on zero interest rates, especially since the US and Chinese suggested that fiscal action taken to improve an economy was perfectly acceptable.  That said, don’t look for the Japanese economy to lift off anytime soon; but it may help dampen the rate of decline.

Of course, the real chuckler of the week came from none other than our beloved Fed chairperson when she allowed that she wouldn’t rule out zero interest rates as a policy tool here.  This lady is either delusional or she is considering becoming the head of marketing for the new Rocky Mountain High cigarettes.  She needs to do a quick check of the success that the Japanese have experienced with zero interest rates and then shut the f**k up.

            Bottom line: last week’s US economic news was better than a sharp stick in the eye; though I need a lot more of this kind of data flow before I get too encouraged.  Earnings season is over; and while reported profits were better than estimates, those estimates had been lowered considerably.  Plus those reported earnings have been propped up with so much funny accounting, I think that they only marginally reflect the real numbers.  The overseas stats did nothing to contribute to any improvement in the outlook; and if you don’t believe me review the dialogue coming out of Japan.  Finally, pray that Yellen was just having a senior moment.  If the Fed goes to negative rates, the mispricing and misallocation of assets will get much worse. 

            Stock prices remain in some sort of never never land, which is to say, grossly overvalued.  The best investment strategy at the moment is to sell a portion of your winners and get rid of the losers.

            Another warning from David Stockman (medium):
           
    News on Stocks in Our Portfolios
 
Nike (NYSE:NKE) declares $0.16/share quarterly dividend, in line with previous

Economics

   This Week’s Data

            The New York Fed manufacturing index came in at -9.02 versus expectations of +7.00

   Other

            Quote of the day (short):

Politics

  Domestic

  International War Against Radical Islam

            This makes you stop and think (medium):


Visit Investing for Survival’s website (http://investingforsurvival.com/home) to learn more about our Investment Strategy, Prices Disciplines and Subscriber Service.